What is non-uniform sampling?
Introduction
Non-uniform sampling is best described pictorially (Figure 1). In a normal 3D run (say a triple resonance experiment) a series of fids are acquired in the 13C and 15N evolution periods, at fixed (regularly spaced) intervals (the dwell times of each dimension). These are represented by the dots on the 2D grid in Figure 1A. To get reasonable resolution (though not optimum) we need to acquire, say, 64 x 32 fids. That is a total of 2048 fids (in fact it is 4 times this for technical reasons such as quadrature detection). Sampling has to be sufficient to cover all possible values for signal evolution. In Figure 1B, only 500 samples (fids) are acquired, but this time not in regularly spaced intervals, but they do sample the same space as in 1A (well 62 x 40). The is non-uniform sampling. In this example (1B) the time to acquire the non-uniform datasets is ~ 5-fold less than that for the normal spectrum (1A). Note we have sampled the same space, just not so efficiently.
Figure 1
The problem is whereas FT of 1A (in the 13C or 15N evolution) will give a nice and well resolved peaks, for 1B, the data set is undersampled and regular FT will look lousy. Of course, we are aware of algorithms that can predict the correct position in a fid based on the points preceding or succeeding it. Linear prediction, is used to extended an fid (and hence resolution) or even to reconstruct points. But this requires enough information or sampling to do this reliably. For our case below, the missing samples are so irregular (and non-linear) and numerous, that LP techniques do not work.
Fortunately a technique known as maximum entropy reconstruction is able to reconstruct quite accurately the missing samples. An intrinsic property of maximum entropy is that it is non-linear (unlike LP) and can therefore be applied to non-linear sampling schemes shown in Fig 1B. One problem is it cannot be relied on for quantitative experiments so don't try it on NOESY's.
Sampling Schemes
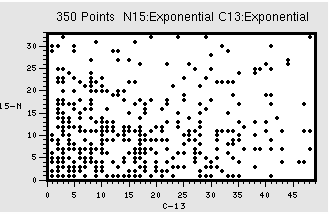
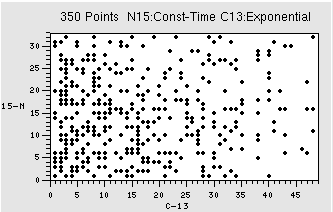
You do need to come up with a sampling scheme that has enough information for the MaxEnt technique to work. As you can see above, for regular evolutions (13C) you want to sample the signal more at the beginning of the fid as this is where most of the signal is. However, for a constant time evolution, a random spread of sampling should be OK. Figure 2 shows example sampling schedules , in this case for a 350 point schedule, for exponential (2A) and constant-time evolutions (15N of 2B). Note how for 350 points the total space sampled is much less (In this case a 32 x 48 points, as opposed to 64 x 40 shown in Fig. 1B), so your resolution will be poorer. So, remember, if your sample is NMR challenged (low concerntration, high mol wt) you might have to sacrifice resolutiion
Figure 2
What are the advantages?
Clearly less time to acquire your spectra. Using the above 500 point sampling scheme, a reduction in time by 5-fold is obtained. However, if you have really small sweep widths or disperse signal you can use even fewer points, e.g. a 350 point sampling scheme (which gives a 7-fold decrease in acquisition time). So for a strong sample, you can get the data very quickly, or for a weak sample you can acquire a lot more scans in the same time as a conventional experiment. For example, to acquire a linear 40x62 matrix with 32 scans takes approximately the same time to acquire a 500 point scheme (Fig 1B) with 160 scans an increase in s/n by ~ 2.2.
Finally
The MaxEnt technique cannot get peaks out of noise,. Therefore, you need to be certain that your S/N is sufficient to see the required peaks
Create a schedule with COAST or RNMRTK script generator.
For coast use 15Nfast. For processing you will have to reverse the schedule
For RNMRTK you need to revsere the schedule for VNMRJ, and use the original for processing (very confusing I know).
Use something like this for processing:
#note for phasing in direct set to 0
#then use nmrDraw to get phase.
#take this phase and add 90 deg - it works
rnmrtk << EOF
shell "export MP_SET_NUMTHREADS=2"
LOADVNMR t1 t2 TR120 D23 ./fid DEBUG
SETPAR SF3 599.7349
SETPAR SF1 150.8031
SETPAR SF2 60.7706
SETPAR PPM3 4.772
SETPAR PPM1 47.387
SETPAR PPM2 118.292
SETPAR QUAD3 States
SETPAR QUAD1 States-TPPI
SETPAR QUAD2 States-TPPI
dim t3
fidpbc 5
sinebell shift 2
zerofill 1024
fft 0.5
sefix1 t2
shrink 512 1
shell "msa2d t1 t2 ./msa2d_param"
dim f3
phase abs 292. 0.
realpart
dim f2
# phase abs 0. 0.
realpart
dim f1
# reverse
# phase abs 0. 0.
realpart
putmat nonlin_spectrum.mat
putmat nonlin_spectrum.mat
shell "rm -r ft"
shell "mkdir ft"
putnmrpipe ft/test%03d.ft3
shell "/nfs/usr/NMRPipe/com/proj3D.tcl"
EOF
This can take a real long time so I have wriiten scripts to put this over a cluster
Check the Makefile in the HNCO or CBCACONH in my NLS directory.
Use this as an exmaple: alter filename, number of expected peaks, etc.
NOTE: This requires a 2D HSQC peak list as a basis set:
note you can forse it to make even better resolution by increasinf nimax numbers after acquisition.
To get initial phases etc. choose a small region in NH with only a few peaks: do steps 1 and 2 below. Then type “make all”
Change phase in the fidSP.com script
For cluster you need to do the following:
make initilaize
make infiles
make allcluster
cd to runs directory: and type makemdd.sh DO THIS ONLY ONCE
cd to original directory and type mddcluster.sh
This is setup for doing a large ppm widths (over 17 machines).
Final processing can be done with “make specs”